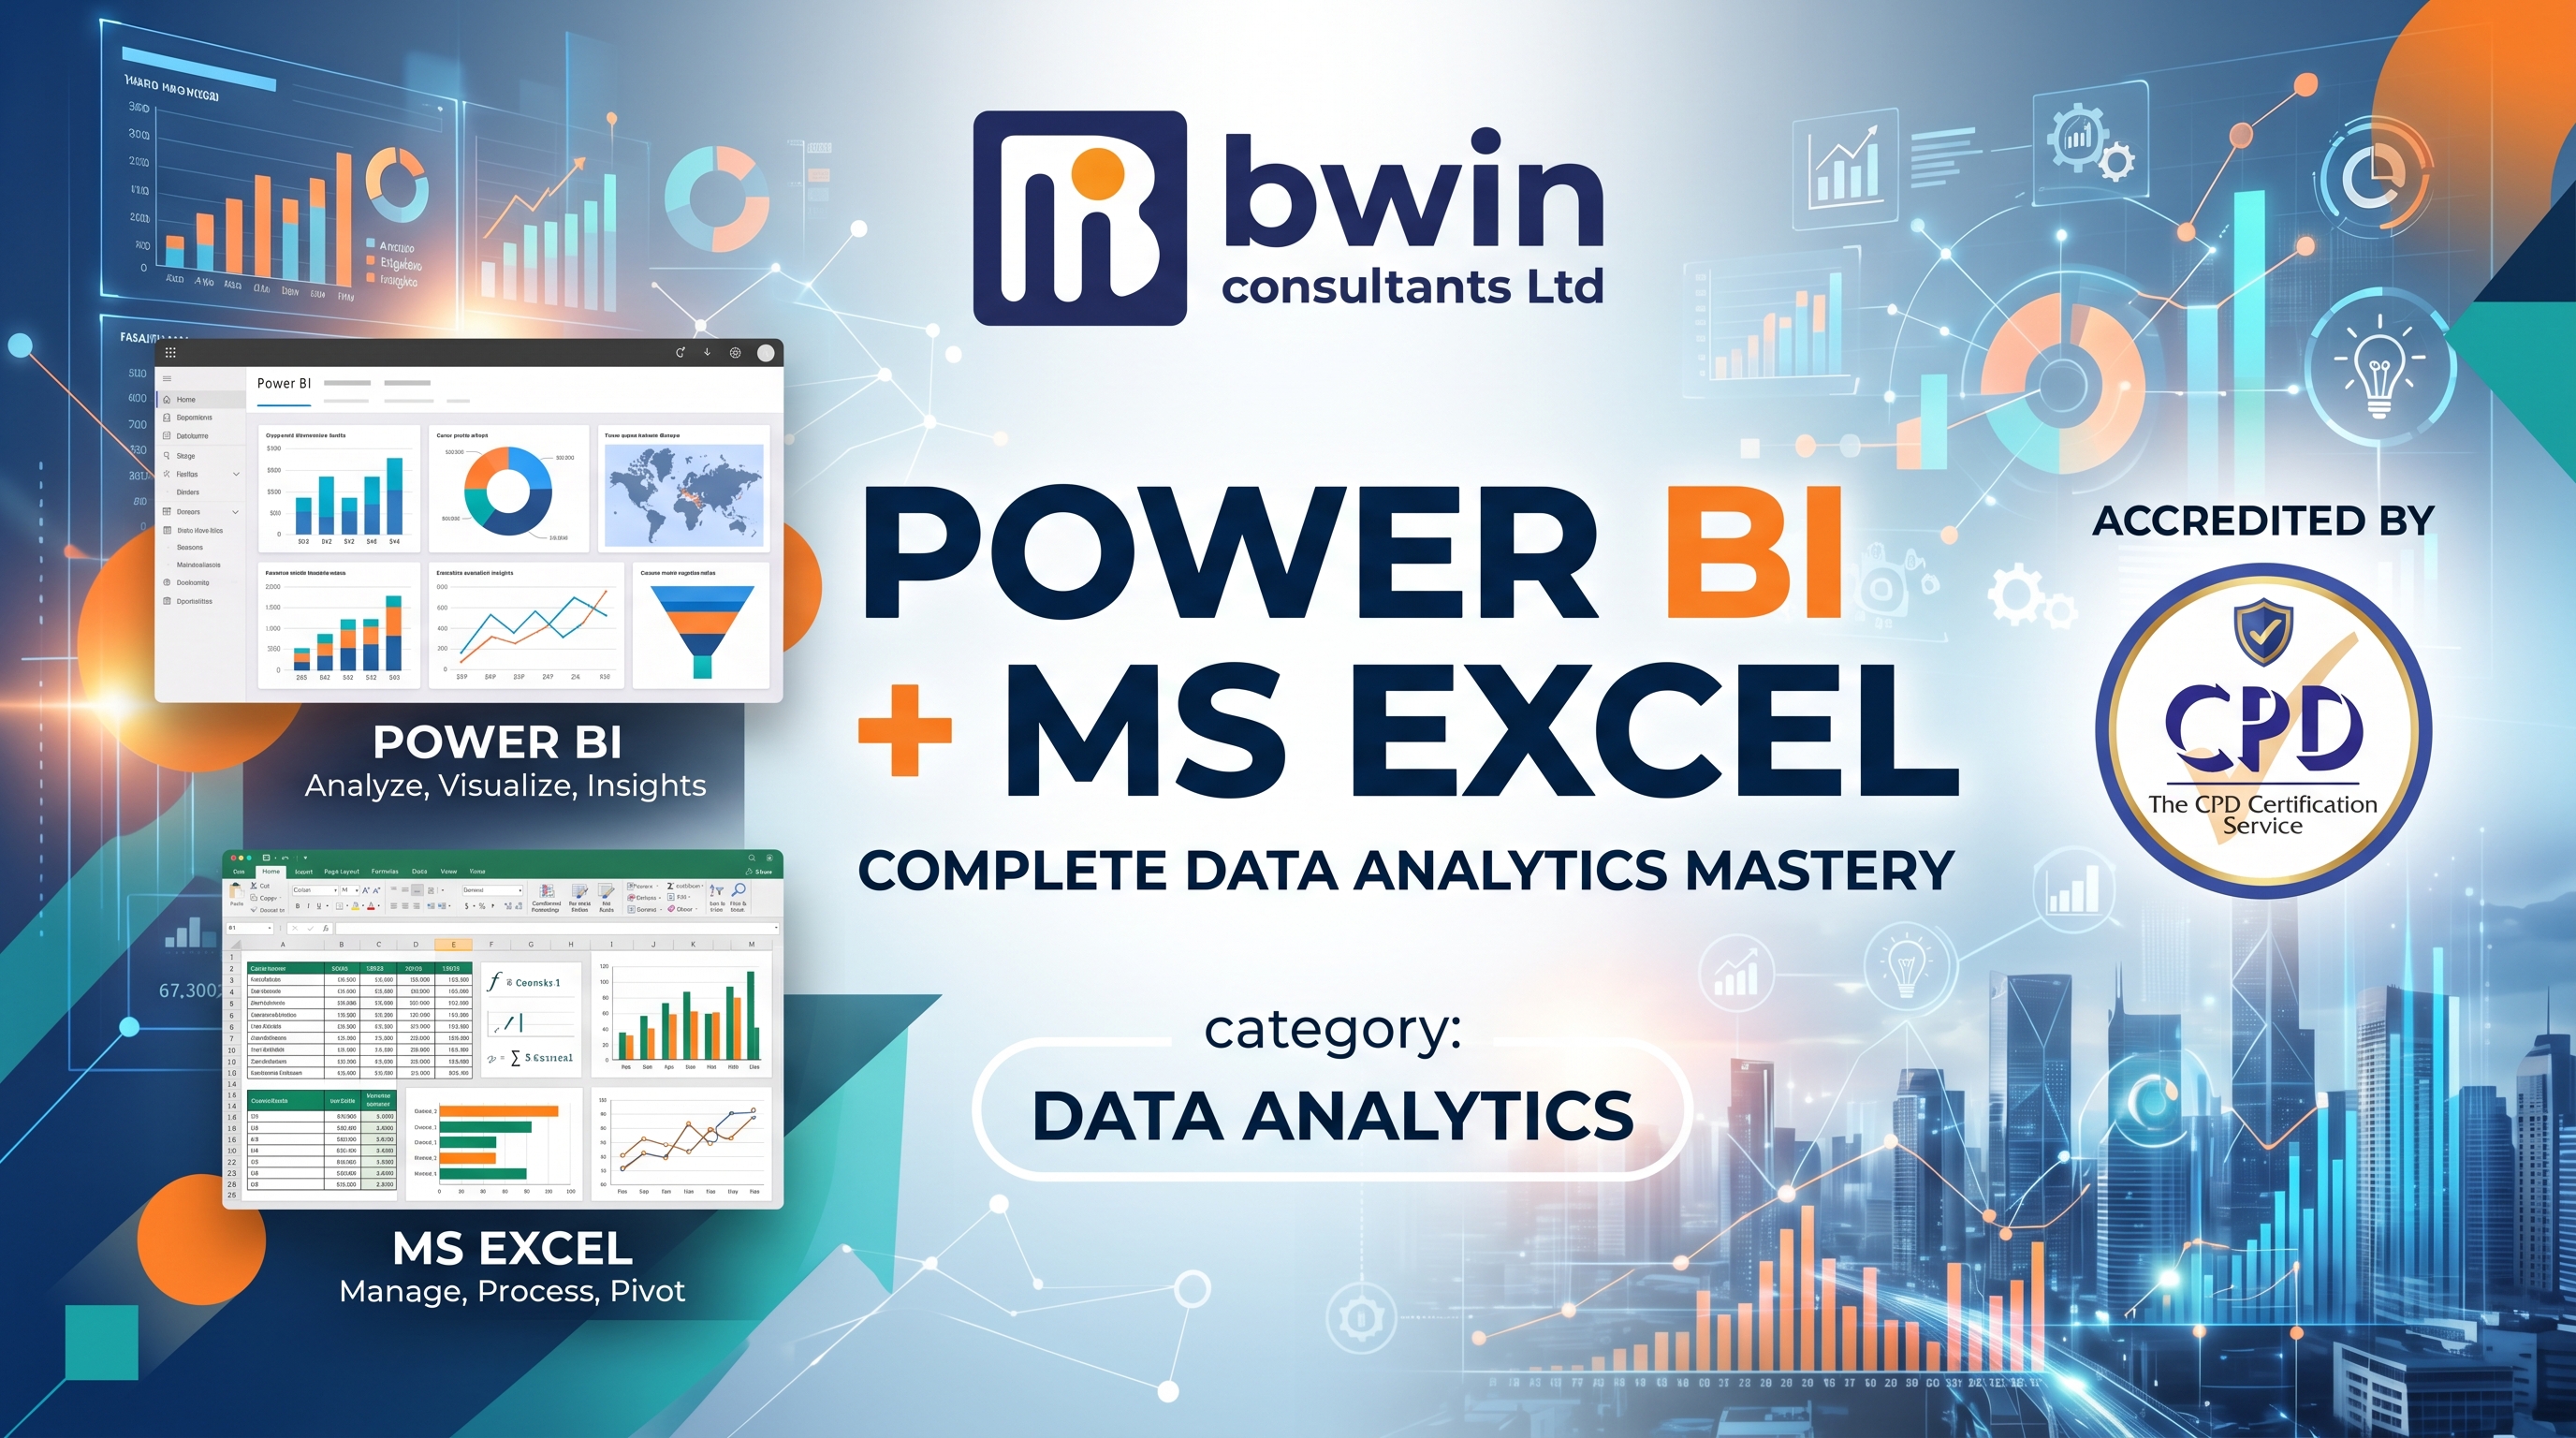
What this course is: A combination of spreadsheet analysis and business intelligence.
Learning outcomes:
Analyze data in Excel — Use formulas, tables, PivotTables and charts.
Clean data — Prepare messy business data for analysis.
Create Power BI dashboards — Turn datasets into interactive reports.
Connect Excel with Power BI — Transfer and analyze Excel-based data in Power BI.
Present business insights — Communicate findings through dashboards and visualizations.
In simple terms: This combination is particularly useful for becoming a reporting, MIS or junior data analyst professional.
Projects you'll build
E-Commerce Sales & Profitability Dashboard
Build a fully functional sales dashboard by transforming raw regional spreadsheets into a relational data model using Power BI and Excel.
Automated data cleansing, relational data modeling, DAX measures for YTD growth, interactive drill-through pages, and dynamic currency conversion.Tech Stack: Microsoft Excel (Power Query, Power Pivot) & Power BI Desktop (DAX, Service Workspace).DAXPower QueryPower PivotExcel Formulas
Project thumbnail
Who this course is for
Students, fresh graduates, MIS executives, Data Analysts, Business Analysts, accountants, engineers and office professionals.
What you need before you start
Basic computer knowledge. Excel experience is helpful but beginners can usually start.
Job Success
Graduates get resume reviews, mock interviews, and warm introductions to our hiring partners once the course wraps up. See more on our Job Success page.
Arif Chowdhury
Data Analyst
Apex Retail Group
Sabrina Rahman
Business Intelligence Analyst
Dhaka Data Systems
Reviews
4.8 average from 2 reviews.
Arif Chowdhury
Arif Chowdhury
Extremely practical and engaging!
I loved how the instructor walked through end-to-end data modeling. Being able to connect Excel sheets directly into Power BI workspaces and set up automated refreshes saved me hours of manual work. A must-take for anyone working with business data!
Alex James
Masterclass in business intelligence!
This course bridged the gap between basic spreadsheet tracking and advanced data visualization perfectly. The modules on integrating Power BI with Excel completely changed how our team handles monthly reporting. Highly practical and well-structured!
Frequently asked questions
Have a different question? See our full FAQ page or book a call with a consultant.
Payment options
Pay in full or split into installments at checkout. We accept major cards and mobile banking.
1
Choose your batch
Confirm the batch dates that work for you — the best available discount is applied automatically.
2
Select a payment method
Choose card, mobile banking (bKash/Nagad/Rocket), or bank transfer at checkout.
3
Pay in full or split it
Pay the full amount now, or choose installments and pay the rest before the batch starts.
4
Get your confirmation
You’ll get an email receipt and a welcome message with your class link and schedule.
5
Start learning
Your seat is confirmed — join the batch on the start date shown on this page.
Checkout screen preview
CardbKash / Nagad / RocketBank transfer
Still deciding?
Talk to a consultant about whether this course fits your goals.